CCSN Neutrino Flavor Oscillations (Obsolete)
Tests flavor oscillations in supernova neutrinos using the very simple calculation from SNOwGloBES.
[2]:
%matplotlib inline

from asteria import config, source
from asteria.neutrino import Flavor

import astropy.units as u

import numpy as np
import matplotlib as mpl
import matplotlib.pyplot as plt

mpl.rc('font', size=16)
Load Configuration
This will load the source configuration from a file.
For this to work, either the user needs to have done one of two things:
Run
python setup.py installin the USSR directory.Run
python setup.py developand set the environment variableUSSRto point to the git source checkout.
If these were not done, the initialization will fail because the paths will not be correctly resolved.
[3]:
conf = config.load_config('../../data/config/test.yaml')
ccsn = source.initialize(conf)
[4]:
t12 = 0.588
s2t12 = 0.31
c2t12 = 0.69
[48]:
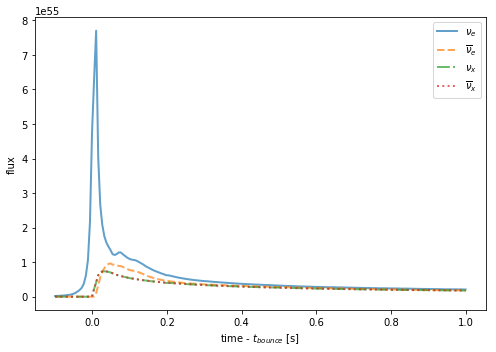
fig, ax = plt.subplots(1,1, figsize=(7,5))

t = np.linspace(-0.1, 1, 201) * u.s
for ls, flavor in zip(["-", "--", "-.", ":"], Flavor):
    flux = ccsn.get_flux(t, flavor)

    ax.plot(t, flux, ls, lw=2, label=flavor.to_tex(), alpha=0.7)
# plt.yscale('log')
# plt.ylim(3e51, 5e53)
ax.set(xlabel='time - $t_{bounce}$ [s]',
       ylabel='flux')
ax.legend()
fig.tight_layout()
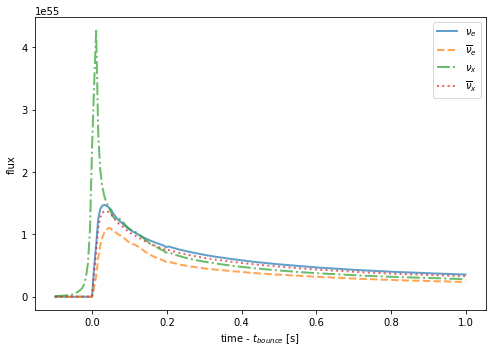
Normal Hierarchy
[49]:
fig1, ax = plt.subplots(1,1, figsize=(7,5))
t = np.linspace(-0.1, 1, 201) * u.s

nu_list = []
i = 0
for flavor in Flavor:
    flux = ccsn.get_flux(t, flavor)
    nu_list.append(flux)

nu_e = [a + b for a, b in zip(nu_list[2], nu_list[3])]
nu_x = [(a + b + c)/2 for a, b, c in zip(nu_list[0], nu_list[2], nu_list[3])]
nu_e_bar = [a*c2t12 + (b + c)*s2t12 for a, b, c in zip(nu_list[1], nu_list[2], nu_list[3])]
nu_x_bar = [((1.0-c2t12)*a + (1.0+c2t12)*(b + c))/2 for a, b, c in zip(nu_list[1], nu_list[2], nu_list[3])]
nu_new = [nu_e, nu_e_bar, nu_x, nu_x_bar]

for ls, i, flavor in zip(["-", "--", "-.", ":"], range(len(nu_new)), Flavor):
    new_flux = nu_new[i]
    ax.plot(t, new_flux, ls, lw=2, alpha=0.7, label=flavor.to_tex()),

# plt.yscale('log')
# plt.ylim(3e51, 5e53)

ax.set(xlabel='time - $t_{bounce}$ [s]',
       ylabel='flux')
ax.legend()
fig1.tight_layout()
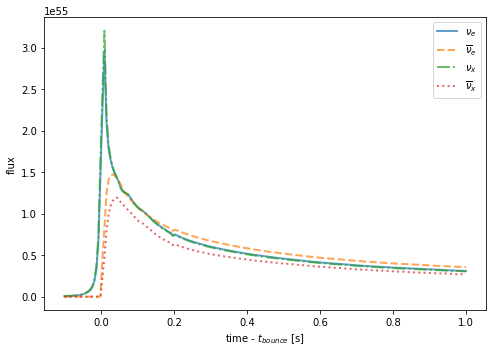
Inverted Hierarchy
[50]:
fig2, ax = plt.subplots(1,1, figsize=(7,5))
t = np.linspace(-0.1, 1, 201) * u.s

nu_list = []
i = 0
for flavor in Flavor:
    flux = ccsn.get_flux(t, flavor)
    nu_list.append(flux)

nu_e = [a*s2t12 + (b + c)*c2t12 for a, b, c in zip(nu_list[0], nu_list[2], nu_list[3])]
nu_x = [((1.0-s2t12)*a + (1.0+s2t12)*(b + c))/2 for a, b, c in zip(nu_list[0], nu_list[2], nu_list[3])]
nu_e_bar = [a + b for a, b in zip(nu_list[2], nu_list[3])]
nu_x_bar = [(a + b + c)/2 for a, b, c in zip(nu_list[1], nu_list[2], nu_list[3])]
nu_new = [nu_e, nu_e_bar, nu_x, nu_x_bar]

for ls, i, flavor in zip(["-", "--", "-.", ":"], range(len(nu_new)), Flavor):
    new_flux = nu_new[i]
    ax.plot(t, new_flux, ls, lw=2, alpha=0.7, label=flavor.to_tex()),

# plt.yscale('log')
# plt.ylim(3e51, 5e53)

ax.set(xlabel='time - $t_{bounce}$ [s]',
       ylabel='flux')
ax.legend()
fig2.tight_layout()
[135]:
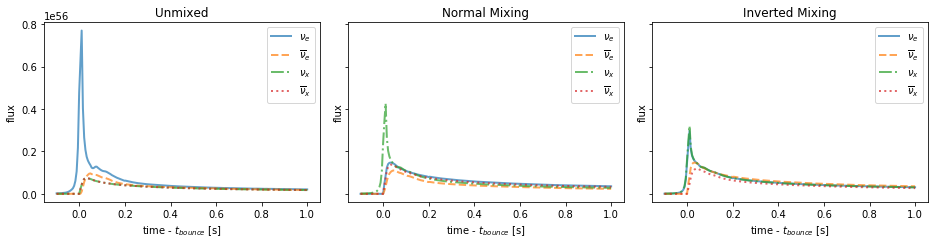
fig, axes = plt.subplots(1, 3, figsize=(13,3.5), sharex=True, sharey=True)

ax1, ax2, ax3 = axes
t = np.linspace(-0.1, 1, 201) * u.s

#UNMIXED

for ls, flavor in zip(["-", "--", "-.", ":"], Flavor):
    flux = ccsn.get_flux(t, flavor)

    ax1.plot(t, flux, ls, lw=2, label=flavor.to_tex(), alpha=0.7)
    ax1.set_title("Unmixed")
# plt.yscale('log')
# plt.ylim(3e51, 5e53)
ax1.set(xlabel='time - $t_{bounce}$ [s]',
        ylabel='flux')
ax1.legend()

#NORMAL MIXING

nu_list1 = []
i = 0
for flavor in Flavor:
    flux = ccsn.get_flux(t, flavor)
    nu_list1.append(flux)

'''Components of nu_list1
   ----------------------
   nu_list1[0]: initial flux of nu_e
   nu_list1[1]: initial flux of nu_e_bar
   nu_list1[2]: initial flux of nu_x
   nu_list1[3]: initial flux of nu_x_bar
'''

nu_e1 = [a + b for a, b in zip(nu_list1[2], nu_list1[3])]
nu_x1 = [(a + b + c)/2 for a, b, c in zip(nu_list1[0], nu_list1[2], nu_list1[3])]
nu_e_bar1 = [a*c2t12 + (b+c)*s2t12 for a, b, c in zip(nu_list1[1], nu_list1[2], nu_list1[3])]
nu_x_bar1 = [((1.0-c2t12)*a + (1.0+c2t12)*(b+c))/2 for a, b, c in zip(nu_list1[1], nu_list1[2], nu_list1[3])]
nu_new1 = [nu_e1, nu_e_bar1, nu_x1, nu_x_bar1]

for ls, i, flavor in zip(["-", "--", "-.", ":"], range(len(nu_new1)), Flavor):
    new_flux1 = nu_new1[i]
    ax2.plot(t, new_flux1, ls, lw=2, alpha=0.7, label=flavor.to_tex())
    ax2.set_title(label="Normal Mixing")

# plt.yscale('log')
# plt.ylim(3e51, 5e53)

ax2.set(xlabel='time - $t_{bounce}$ [s]',
        ylabel='flux')

ax2.legend()

#INVERTED MIXING

nu_list2 = []
i = 0
for flavor in Flavor:
    flux = ccsn.get_flux(t, flavor)
    nu_list2.append(flux)

'''Components of nu_list2
   ----------------------
   nu_list2[0]: initial flux of nu_e
   nu_list2[1]: initial flux of nu_e_bar
   nu_list2[2]: initial flux of nu_x
   nu_list2[3]: initial flux of nu_x_bar
'''

nu_e2 = [a*s2t12 + (b + c)*c2t12 for a, b, c in zip(nu_list2[0], nu_list2[2], nu_list2[3])]
nu_x2 = [((1.0-s2t12)*a + (1.0+s2t12)*(b+c))/2 for a, b, c in zip(nu_list2[0], nu_list2[2], nu_list2[3])]
nu_e_bar2 = [a + b for a, b in zip(nu_list2[2], nu_list2[3])]
nu_x_bar2 = [(a + b + c)/2 for a, b, c in zip(nu_list2[1], nu_list2[2], nu_list2[3])]
nu_new2 = [nu_e2, nu_e_bar2, nu_x2, nu_x_bar2]

for ls, i, flavor in zip(["-", "--", "-.", ":"], range(len(nu_new2)), Flavor):
    new_flux2 = nu_new2[i]
    ax3.plot(t, new_flux2, ls, lw=2, alpha=0.7, label=flavor.to_tex())
    ax3.set_title(label="Inverted Mixing")

# plt.yscale('log')
# plt.ylim(3e51, 5e53)

ax3.set(xlabel='time - $t_{bounce}$ [s]',
        ylabel='flux')
ax3.legend()


fig.tight_layout()
# print(nu_e2[200], nu_x2[200])
Mixing with Gaussian error
[78]:
s2t12_er = c2t12_er = 0.013 #symmetrical error assumed
[205]:
def errors(nulist):
    '''Calculates the upper and lower edge of the 1sigma, 2sigma, and 3sigma uncertainty intervals
    Parameter
    ---------
    nulist: ndarray
        list of neutrino fluxes after mixing, with random samples of the mixing angle

    Returns
    -------
    std: ndarray
        standard deviation of neutrino fluxes at each time bin
    mean: ndarray
        mean of neutrino fluxes at each time bin
    sig1_lo, sig1_hi: ndarray
        lower and upper ends of the 1sigma interval
    sig2_lo, sig2_hi: ndarray
        lower and upper ends of the 2sigma interval
    sig3_lo, sig3_hi: ndarray
        lower and upper ends of the 3sigma interval'''


    std, mean, sig1_lo, sig1_hi, sig2_lo, sig2_hi, sig3_lo, sig3_hi = [], [], [], [], [], [], [], []
    for i in range(len(nulist)):
        s3l, s2l, s1l, s1h, s2h, s3h  = np.percentile(nulist[i], [0.05, 2.5, 16, 84, 97.5, 99.5])
        sig3_lo.append(s3l)
        sig2_lo.append(s2l)
        sig1_lo.append(s1l)
        sig1_hi.append(s1h)
        sig2_hi.append(s2h)
        sig3_hi.append(s3h)
        std.append(np.std(nulist[i]))
        mean.append(np.mean(nulist[i]))
    std = np.asarray(std)
    mean = np.asarray(mean)
    return std, mean, sig1_lo, sig1_hi, sig2_lo, sig2_hi, sig3_lo, sig3_hi
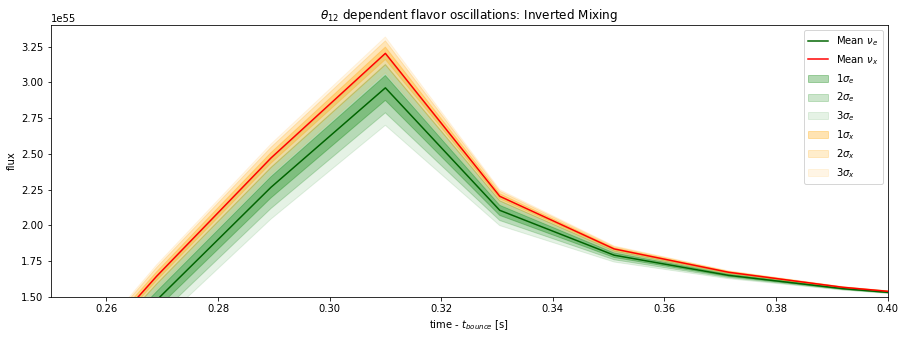
Inverted Mixing
[206]:
fig1, ax = plt.subplots(1, 1, figsize=(15,5), sharex = True, sharey = True)
t = np.linspace(-0.1, 4, 201) * u.s

s2t12_val = np.random.normal(loc = s2t12, scale = s2t12_er, size = 1000)
c2t12_val = 1 - s2t12_val

nu_e2_er = [a*s2t12_val + (b + c)*c2t12_val for a, b, c in zip(nu_list2[0], nu_list2[2], nu_list2[3])]
std_e, mean_e, sig1_lo_e, sig1_hi_e, sig2_lo_e, sig2_hi_e, sig3_lo_e, sig3_hi_e = errors(nu_e2_er)

ax.fill_between(t, sig1_lo_e, sig1_hi_e, color='g', alpha=0.3, label = r'$1\sigma_{e}$')
ax.fill_between(t, sig2_lo_e, sig2_hi_e, color = 'g', alpha = 0.2, label = '$2\sigma_e$')
ax.fill_between(t, sig3_lo_e, sig3_hi_e, color='g', alpha = 0.1, label = '$3\sigma_e$')
ax.plot(t, mean_e, 'darkgreen', label=r'Mean $\nu_e$')

nu_x2_er = [((1.0-s2t12_val)*a + (1.0+s2t12_val)*(b+c))/2 for a, b, c in zip(nu_list2[0], nu_list2[2], nu_list2[3])]
std_x, mean_x, sig1_lo_x, sig1_hi_x, sig2_lo_x, sig2_hi_x, sig3_lo_x, sig3_hi_x = errors(nu_x2_er)
ax.fill_between(t, sig1_lo_x, sig1_hi_x, color='orange', alpha=0.3, label=r'$1\sigma_x$')
ax.fill_between(t, sig2_lo_x, sig2_hi_x, color = 'orange', alpha = 0.2, label = r'$2\sigma_x$')
ax.fill_between(t, sig3_lo_x, sig3_hi_x, color='orange', alpha = 0.1, label = r'$3\sigma_x$')
ax.plot(t, mean_x, 'r', label=r'Mean $\nu_x$')


ax.set(xlabel='time - $t_{bounce}$ [s]',
        xlim = (0.25, 0.4),
        ylabel='flux',#, yscale ='log',
        ylim=(1.5e55, 3.4e55),
      title = r'$\theta_{12}$ dependent flavor oscillations: Inverted Mixing')
ax.legend()

fig.tight_layout()
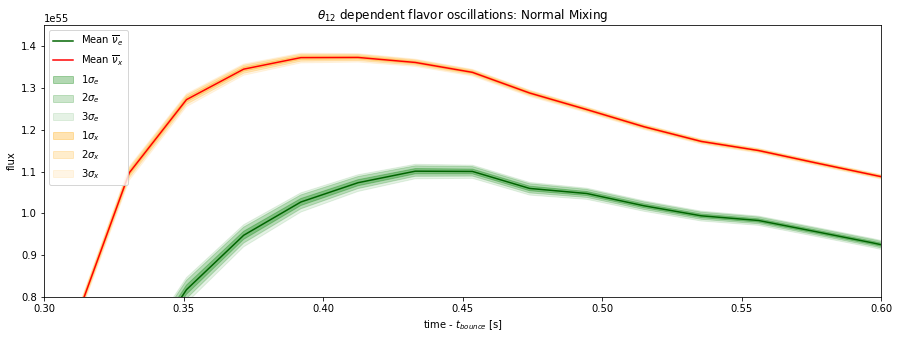
Normal Mixing
[207]:
fig1, ax = plt.subplots(1, 1, figsize=(15,5), sharex = True, sharey = True)
t = np.linspace(-0.1, 4, 201) * u.s

s2t12_val = np.random.normal(loc = s2t12, scale = s2t12_er, size = 1000)
c2t12_val = 1 - s2t12_val
nu_ebar_er = [a*c2t12_val + (b+c)*s2t12_val for a, b, c in zip(nu_list1[1], nu_list1[2], nu_list1[3])]
std_e, mean_e, sig1_lo_e, sig1_hi_e, sig2_lo_e, sig2_hi_e, sig3_lo_e, sig3_hi_e = errors(nu_ebar_er)

ax.fill_between(t, sig1_lo_e, sig1_hi_e, color='g', alpha=0.3, label = '$1\sigma_e$')
ax.fill_between(t, sig2_lo_e, sig2_hi_e, color = 'g', alpha = 0.2, label = '$2\sigma_e$')
ax.fill_between(t, sig3_lo_e, sig3_hi_e, color='g', alpha = 0.1, label = '$3\sigma_e$')
ax.plot(t, mean_e, color='darkgreen', label=r'Mean $\overline{\nu}_e$')

nu_xbar_er = [((1.0-c2t12_val)*a + (1.0+c2t12_val)*(b+c))/2 for a, b, c in zip(nu_list1[1], nu_list1[2], nu_list1[3])]
std_x, mean_x, sig1_lo_x, sig1_hi_x, sig2_lo_x, sig2_hi_x, sig3_lo_x, sig3_hi_x = errors(nu_xbar_er)
ax.fill_between(t, sig1_lo_x, sig1_hi_x, color='orange', alpha=0.3, label=r'$1\sigma_x$')
ax.fill_between(t, sig2_lo_x, sig2_hi_x, color = 'orange', alpha = 0.2, label = r'$2\sigma_x$')
ax.fill_between(t, sig3_lo_x, sig3_hi_x, color='orange', alpha = 0.1, label = r'$3\sigma_x$')
ax.plot(t, mean_x, 'r-', label=r'Mean $\overline{\nu}_x$')

ax.set(xlabel='time - $t_{bounce}$ [s]',
          xlim = (0.3, 0.6),
        ylabel='flux',
         ylim=(0.8e55, 1.45e55),
        title = r'$\theta_{12}$ dependent flavor oscillations: Normal Mixing')
ax.legend()

fig.tight_layout()
[ ]: